I just posted an article at Voice of San Diego which, along with its
companion piece, will serve as background to these ongoing valuation
updates. Here’s what they discuss:
- A
framework for measuring San Diego housing valutions (why compare
home prices to local rents and incomes, and what the current elevated
valuations might mean) - How
mortgage rates figure into everything (they haven’t been as big a driver
of home prices as most people believe)
I’ll be referring back to these two articles when I update the
valuation
charts — that way, I can spare regular readers (and myself) the
rehashing of all the background info each time.
So for starters, check those out if you haven’t. The second
article in particular might be of interest even to old-timers, as it’s
the most thorough piece (that I can remember anyway) I’ve written on
the role of mortgage rates.
OK, with that background behind us, let’s check in on the data as of
year-end 2016. Here is the primary chart… San Diego home valuations:
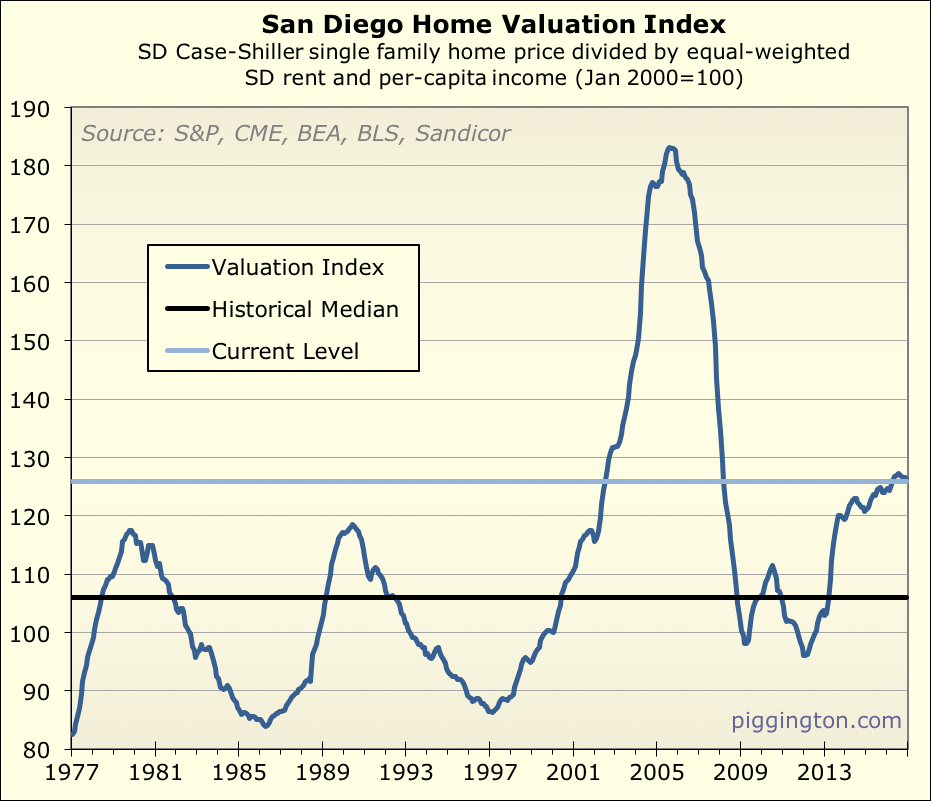
Not much change here since the last update: values are quite a bit
lower than at the 2005 peak, but higher than anytime outside the
bubble, and about 19% over the historical median. For what this might
mean, I have some thoughts in the first
Voice article above, as well as the prior full valuation
update here at the Pigg.
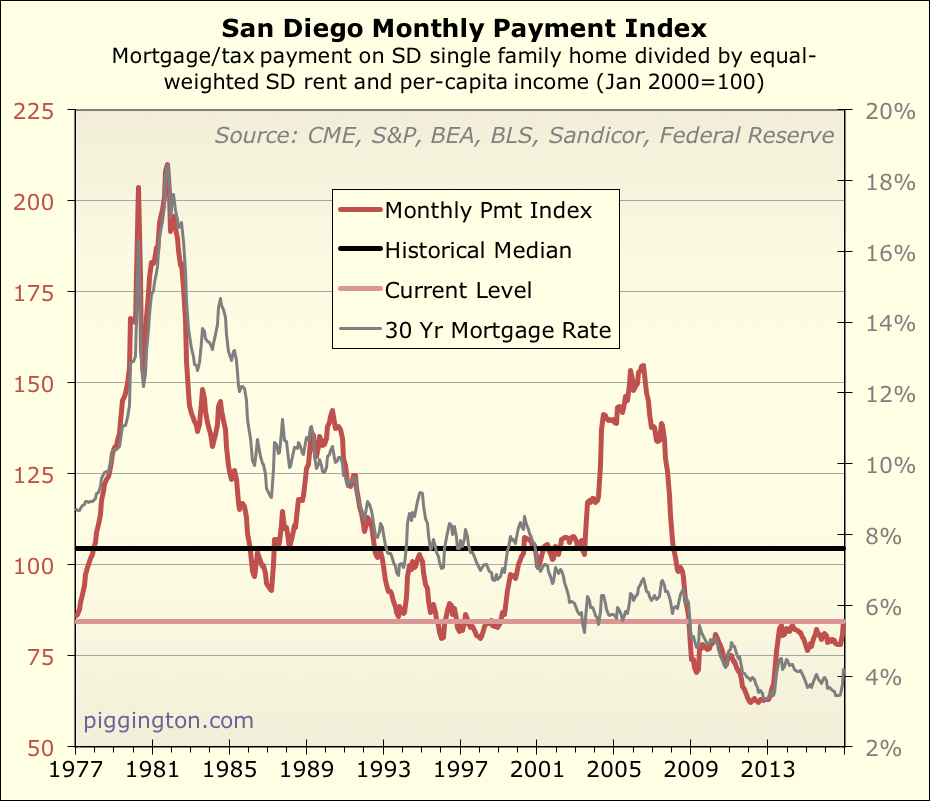
Despite those high valuations, low mortgage rates are keeping a lid on
monthly payments. Even with the recent rate “spike” (and the chart
shows that while abrupt, it wasn’t very big in the grand scheme of
things), monthly payments are less expensive compared to incomes and
rents than they have been for most of the last 40 years.
Now, this is always where things get weird. Prices are high, but
payments are low… which matters more when we are trying to determine
if homes are “cheap” or “expensive”? I think they both matter,
and it’s a complex topic, but — putting it very
briefly — I think prices matter more in the long run. That’s certainly
the way it’s worked out historically, anyway, and there are plausible
reasons why this might be. I explain this in detail in the second
Voice piece.
I certainly acknowledge that rates are a piece of the puzzle, and that
low rates are probably helping keep prices high right now… I just
would caution people against using low rates as an excuse to dismiss
the risks of high purchase valuations. Rates being low doesn’t mean
homes are cheap — it means rates are low. Best not to conflate the two.
Now let’s move onto some bonus Pigg material!
I used to do price-to-income and price-to-rent ratios separately.
I switched to combining them, because they are largely similar, and I
liked having a single valuation indicator that combined everything. But
people have occasionally requested them separated, so for those folks,
here they are:
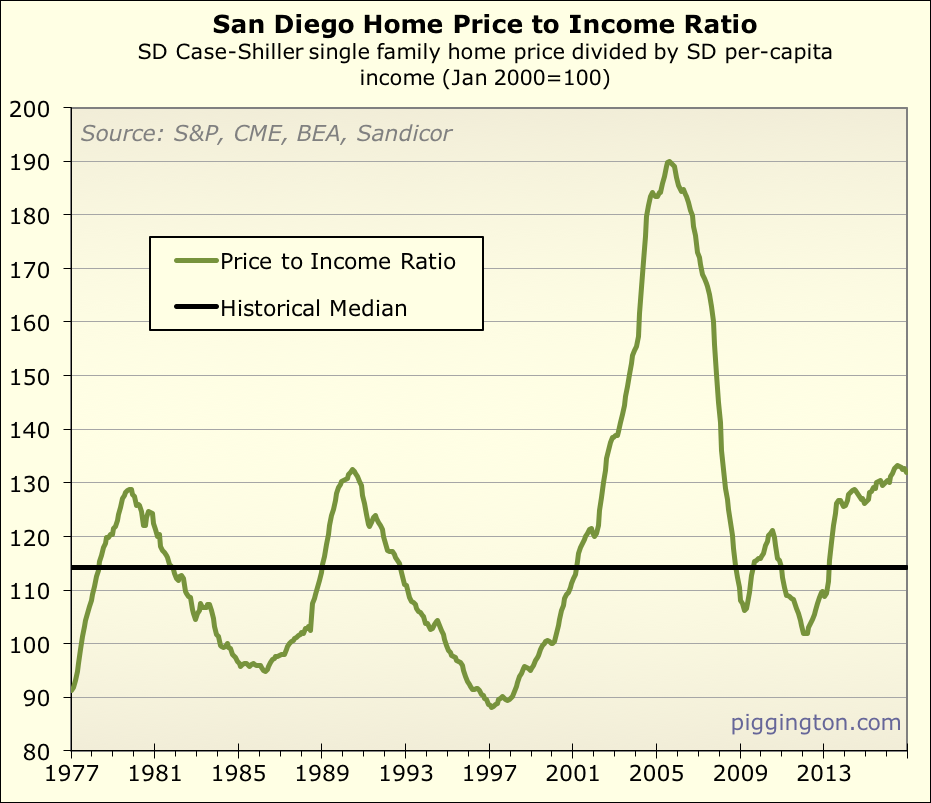
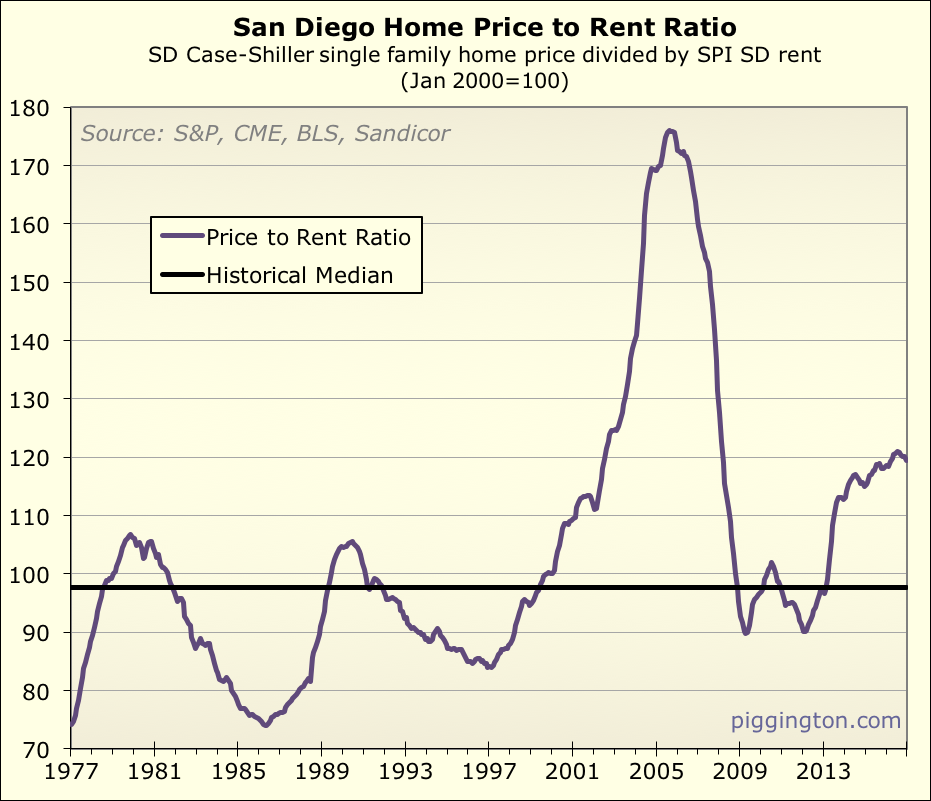
They’ve had some differences over time as rents and incomes have
converged and diverged with one another, but directionally, they’ve
stayed very well in line over time. For what it’s worth, the
price-to-rent ratio is a little higher than price-to-income right now,
compared to its historical median (22% above for p-r, 15% above p-i).
Another potentially interesting difference is that while the p-i ratio
is right at prior (non-bubble) cyclical peaks, the p-r ratio has well
surpassed prior peaks.
This leads one to wonder about the historical relationship between
rents and incomes. I’ve plotted that over the same time period below:
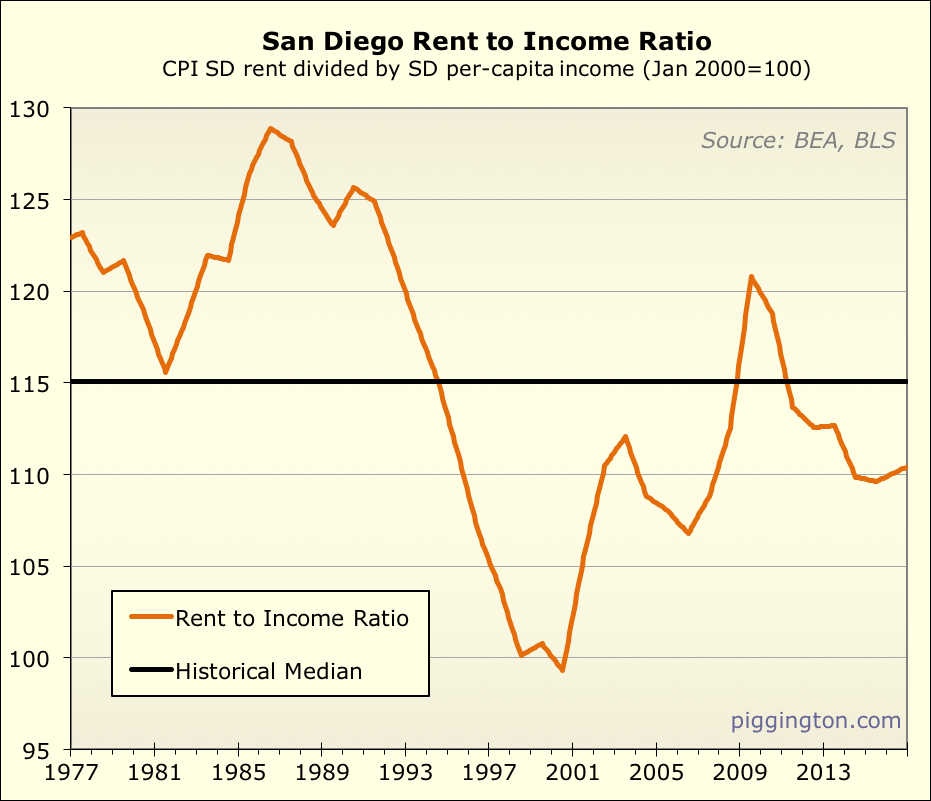
I used January 2000 as the baseline year, same as I do for the
valuation ratios, because that’s what the Case-Shiller index does. By
coincidence, that happened to be an all-time extreme in the ratio —
the year 2000 was the cheapest rent ever got compared to incomes in San
Diego over this period. Anyway, it is perhaps interesting to note
that rents are actually less expensive, compared to incomes, than they
have typically been over this period. Even if you only tracked
post-2000 period we are at the median ratio since that time. So it
can’t really be argued that rents are particularly high in San Diego
right now… in fact, compared to incomes, they are on the low side of
history.
I thought I’d try one more angle on how prices, rents, and incomes
interact, by just showing all three on the same graph. No ratios
here: just actual price, incomes, and rents. (Well, all
normalized to be on the same scale, January 2000 = 100, but no ratios
to one another).
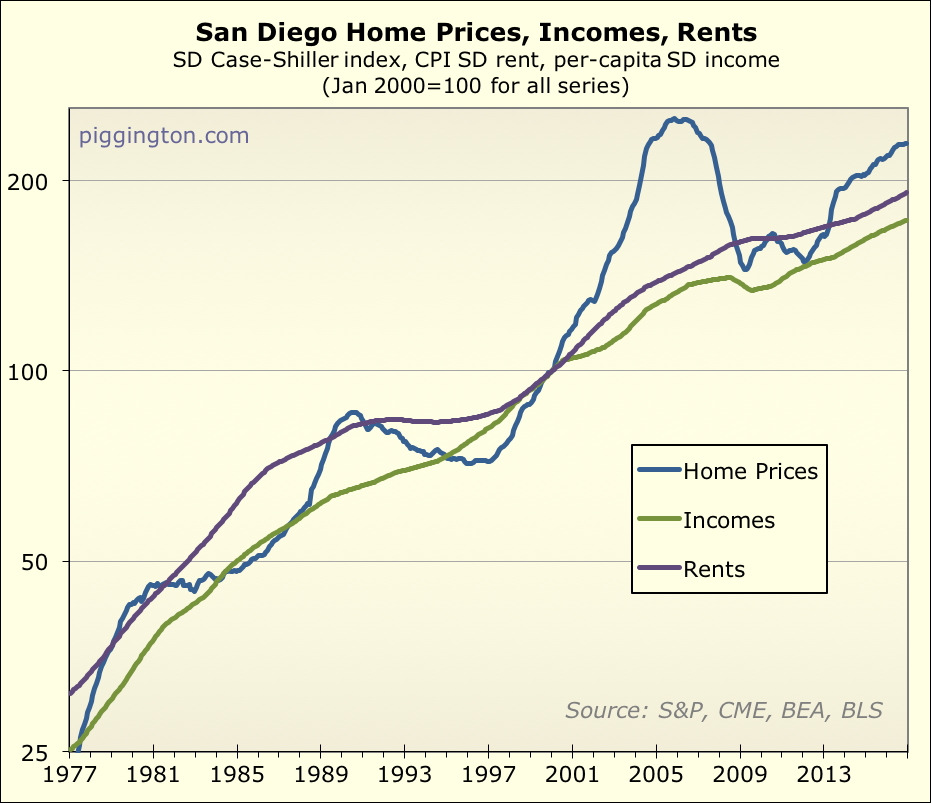
You can see that the moves in incomes and rents are pretty paltry
compared to the giant swings in home prices. Rents and incomes are the
fundamentals that determine home prices over the long term, but in the
short term, lots of other factors (human emotion a major one among
them) can interfere to really push prices far from what their
fundamentals would suggest. And thus shall it ever be…
With respect to the last
With respect to the last graph I’m surprised that incomes did not actually fall in late 2008/2009-2010 era, obviously only the incomes of those working goes into the graph. The second graph shows just how dramatic the inflation of the 80’s was and the bubble of 2005, separated by 25 years. Will gold be the next bubble? The inflation of the 80’s was caused by oil prices and the Housing Bubble was caused by “liar loans”. Even though greed seems to be at the root there is always a positive twist it seems. The oil crisis was a wake up call to alternative energy and the housing bubble was an effort to make having a house easier.P.S.- just took another look at the graph and there is in fact a dip around 2009 for incomes, just not as big as one might have expected.
moneymaker wrote:With respect
[quote=moneymaker]With respect to the last graph I’m surprised that incomes did not actually fall in late 2008/2009-2010 era, obviously only the incomes of those working goes into the graph.[/quote]
That is not correct — it’s per capita income, ie total income divided by population, so job losses would register as a loss of income.
As you noted later in your post, there was a decline after the crisis. Doesn’t look like much on the chart but it was about 5%.