There are no big surprises in the latest batch of housing stats, so I don’t have a whole lot to say that the charts don’t say themselves. Let’s have a look.
Prices
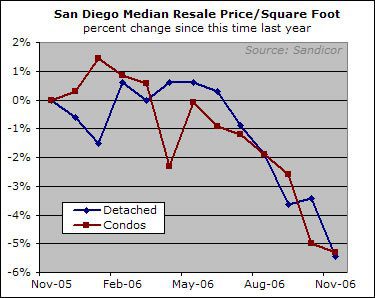
My preferred measure of home price changes, the median price per square foot, was down on the month for both property types, with detached homes notably smacked down after the prior month’s attempt at improvement:
The median price per square foot peaked last September; by this measure San Diego home prices have declined about 8% since that time.
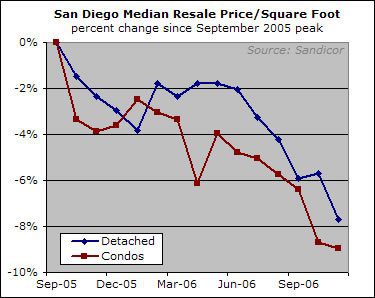
The decline has really picked up the pace since late spring — usually a time of seasonal strength. Since May, the median price per square foot has declined by 6% — far more than the bullish real estate chorus ever acknowledged was possible at all, let alone within six months.
Plain-vanilla median prices, a less accurate but more widely-reported measurement of price movements, were flat for detached units and down for condos, with both numbers registering a sizable year-over-year decline.
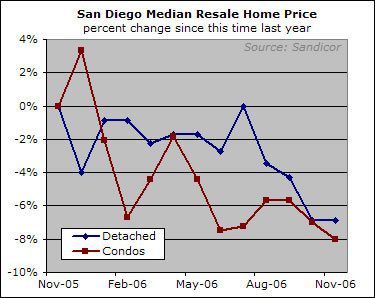
November 2005 was the aggregate peak for median prices, so starting next episode I will include charts for year-over-year median changes in addition to the decline since the 11/2005 peak.
Supply and Demand
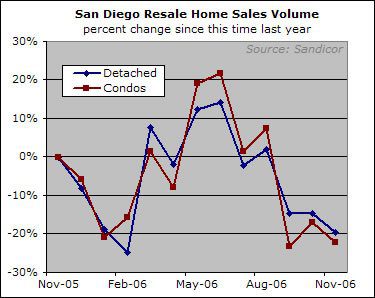
Sales were down "only" 21% since last year — an improvement as far as year-to-year measurements have gone lately:
As sales steadied, sellers took their homes off the market in droves…
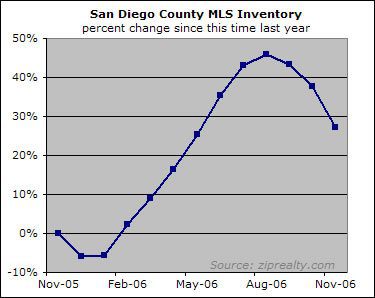
…which resulted in a slight improvement in the months-of-inventory measure:
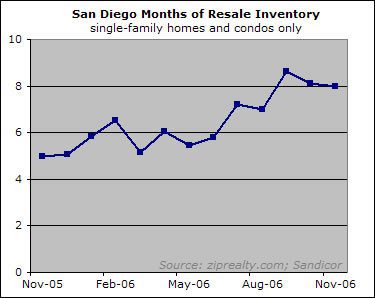
Inventory is shrinking not because there are a lot of sales — there aren’t — but because sellers are giving up for the winter. Perhaps some will give up for good. But resetting mortgage payments, declining real estate industry income, and the recognition by some that there is still a chance to take profits off the table all guarantee that sellers will be back. Look for that inventory number to resume its ascent towards the heavens in February.
Conclusion
There are two reasons to believe that the decline in the market is not over. First, the declining trend in prices shows no signs of letting up and has as a matter of fact accelerated in recent months despite a substantial drop in mortgage rates. Second, the price drop to date has been but a blip in the grand scheme of things. There is no reason to assume that the correction will end while San Diego housing remains so stunningly overpriced.
Nevertheless, various spinmeisters (including our esteemed former Fed Chairman) have emerged to assure the masses that the end of the housing downturn is very near. These proclamations, while in defiance of both empirical data and common sense, are no surprise at all. You can rest assured that these shills will be calling the bottom the whole way down.
*clap* *clap* *clap*
*clap* *clap* *clap* *clap*
hold on for a bumpy ride!!
Rich – thanks for the data.
Rich – thanks for the data. There has been a bit of controversy on some of the threads about whether the case-shiller index is accurately capturing the declines. I wondered, would you be willing to plot your favorite ($/sq ft) versus the CS index from about 2000 or so? I have the CS data, but not the other. I would expect to see them pretty highly correlated, but it would be interesting and informative to see the extent to which these indices are in sync….or not.
Thanks again for this website.
Very fine graphs and
Very fine graphs and commentary, Rich. Thanks for taking the time!
bravo rich.
now here’s the
bravo rich.
now here’s the third reason why the price decline will continue. The ever increasing foreclosures and a decent % coming from mortgage fraud and first payment defaults. see my latest series of First Payment Mortgage Default posts on my blog. need I say more?
Rich, I calculated 9.8
Rich, I calculated 9.8 months supply in September based on attached + detached inventory (source is MLS) is 22,785 divided by sales for attached (648) + detached (1674) both from Dataquick. How did you get a little over 8 months supply? How did you calculate November months supply without having the final sales data for November – are you using pendings as an approximation? I have 9.4 months supply in October, so our data and calculations are off for that month as well. Bob C. wrote in his newsletter we are just under 9 months supply, but your chart shows 8. Another question: are you using average price from the MLS? If you’re using median square foot, how do you get that?