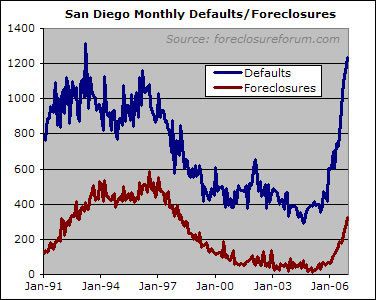
I’ve been doing a lot of yapping about the importance of must-sell inventory (as a catalyst for home price declines) and of mortgage defaults (as an indicator of must-sell inventory). I now offer the inevitable graph, with data kindly provided by local foreclosure guru Ward Hanigan .
This goes in line from a
This goes in line from a person at Chase Mortgage in the Loss of Mitigation Department (preventing foreclosures). The representative mentioned she has never seen so many NOD’s
in her career this year. She mentioned that she had maybe two or three in 2006. She says this year is very different, and now seeing dozens of NODs coming in her dept. She also mentioned that a lot of Temecula homes are in trouble because people are walking away from homes since they have no equity.
Rich, any idea why your
Rich, any idea why your numbers and the Bubble Tracking foreclosure numbers are so different?
They list Foreclosure above your NOD rate. Is your chart of just San Diego City?
Bubble Tracking is listing
Bubble Tracking is listing the number of “foreclosures” currently for sale out on the market. Rich’s chart shows the number of NEW defaults and foreclosures hitting each month.
~b
when you consider the amount
when you consider the amount of fraud that is floating around out there (temecula, murrieta, etc.) then one has to wonder how much of the fraud is contributing to the accelerated rate of NODs/foreclosures.
also, look at the slopes of the two graphs….they are nearly identical. that would lead me to believe that the overwhelming majority of NODs will lead to foreclosure. NAR and Dataquick won’t be able to spin that one for much longer.
“End of line.”
Anyone have or know where to
Anyone have or know where to find similar info for Los Angeles County?
People are still holding on to ridiculous prices out here. My wife and I went walking in our neighborhood and saw a 2300sq ft 5bd, good neighborhood but not Encino or the Hills, but they want $950K.
I Zillowed the house and the “Zestimate” was $850K. Better yet was the owners bought the house in May of ’05 in the $700’s.
My guess is their ARM resset.
At current monthly sales
At current monthly sales rate of 2k-3k doing a little predicting from the graph… we could be at 25% of sales being foreclosure properties… of course that might drive more volume but only at deep discounts. 25%! Fasten your seat belts!
Thank you Rich. I appreciate
Thank you Rich. I appreciate the fact that your graphs’ vertical axis starts from zero, so that the spike in NODs is not an artifact (as we often see in newspapers, where a small change is magnified by tinkering with the axis scale).
It is true that TDs are a subset of NODs. What may increase over time is the % of NODs that end up in foreclosure.
Rich-
Are the numbers for
Rich-
Are the numbers for January available yet? Did the trend continue?
Thanks for the great info,
Thanks for the great info, Rich. I took the % change in trust deed sales from the various years and put them into the graph below. It basically shows the trend in the percent of NODs that end up becoming foreclosures (or trust deed sales). I think the results in the graph speak volumes.
[img_assist|nid=2644|title=|desc=|link=node|align=left|width=466|height=361]
at
at http://www.sddt.com/Finance/economics.cfm you can check the numbers for trustees deeds (foreclosures) and notices of default. January numbers were 457 for foreclosures and 1436 for NODs. Also, you can check the numbers back to 1982, and see that 1436 is the highest mark since march of 1983. So, yes, the trend definitely continued.
Good stuff.
I am the
Good stuff.
I am the publisher of a new mortgage application index, the MAX and the MAXcal which you may find of interest. I am also tracking closed Cal housing sales weekly now and will be adding other MSAs in the near future. You can find the data at mortgagemaxx.us.
Have a great weekend.
PD
Thanks, robson.
I see the
Thanks, robson.
I see the charts, but how did you get the exact numbers from sddt?
if you scroll over the graph
if you scroll over the graph with your mouse and hold it on a single point for a second, it will pop up text displaying the corresponding date and value.
Robson, HereWeGo,
How do you
Robson, HereWeGo,
How do you get to the figure? I cannot find it.
do you need to login?
No, just look on the right
No, just look on the right hand side under the ECONOMIC INIDICATORS heading, right below the market quote box. Click on the Notices of Default link.
It would be really
It would be really interesting to see (for the same area and time) this data with data on home prices like the final plot in the article on January Housing Data. Can an abrupt decline in foreclosures/defaults be used to indicate when the market has bottomed out?
Nice chart, and great
Nice chart, and great insider story from Ramsey.
rockclimber, you are incorrectly concluding that a foreclosure is equivalent to a distress sale on the MLS. Many foreclosures are not on the MLS at all.
In spite of rising foreclosures and vacancy, it’s interesting that prices are not falling more. I just wrote an article on that on my website. http://www.californiahousingforecast.com/commentary/2007/2/18/why-rising-foreclosures-dont-lead-to-lower-prices.html
In a small sample, I found that the people in foreclosure didn’t even have their homes listed for sale on the MLS, and when they did finally list it the price was high and the showing instructions not motivated. How motivated is a gal who has been on foreclosure on and off for a year, and says in her MLS listing instructions “please call 4 hours ahead”. The banks also hold these properties a long time, often without even listing them on the MLS.
What will cool this market? Lending guidelines will change, if not from the regulatory end, from the investor side. That will take some time, but when that happens, watch prices to pop down as they did on the way up.
Remember the big jump in late 2003/early 2004 due to 1.75% Fed funds rate? Watch that same big jump in reverse when banks start asking for money down, or do away with negative amortization or stated income.
Ward Hannigan from foreclosureforum.com gives some great seminars on foreclosures I was told, by some old timers at a recent auction in downtown San Diego. The seminars are in Huntington Beach, but are free and well worth it. These guys who were bidding have been studying with him for many years.
Great info as always. Senor
Great info as always. Senor Piggington you’re always right on track. It finally looks like the insanity in San Diego is beginning to end and we’ll see even greater falling prices in 2007. Also, I just shot up 2006 San Diego Home Prices and according my sources it was the worst on record…
Interesting AG, inflated
Interesting AG, inflated real historical price twice showed the $220-$300K range in 2006 dollars looking normal.
Granted, there’s a bigger tax advantage now on capital gains, but a smaller tax benefit on interest deduction.