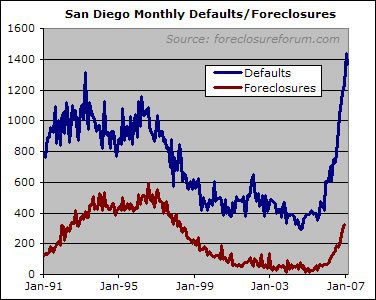
During the month of February, San Diego saw 1,386 new notices of default (NODs), which are filed when homeowners neglect to pay their mortgages. As the first graph shows, this is more NODs than were delivered in any month during the housing downturn of the early 1990s.
Notices of trustee sale (NOTs) are also running high compared to recent years, but they lag NODs and are not yet at their early-90s heights. It is because of this lag that I focus on NODs as a more timely, if still quite approximate, indicator of how much "must-sell" inventory is out on the market.
One interesting thing I got
One interesting thing I got out of this graph is at the rate of increase now. The last time it went up, it was zig zagging up and and down and eventually get to its peak. Now, it seems like it’s heading straight up w/out taking a breath.
Great work Rich! These
Great work Rich! These charts lead me to believe that the price corrections will be just as severe.
Combine this chart with the
Combine this chart with the ARM reset chart and I predict we’re probably a good six months out before NODs stabalize. The question is how high will it be?
Probably about another 2-3 months after that before foreclosures level out which will make for a very ugly end of year.
Rich, side question, do you happen have the data for the chart from ’89 to ’91. It be interesting to see how quickly NODs and NOTs spiked last cycle.
Good stuff Rich. After a
Good stuff Rich. After a request I just shot up my report on San Luis Obispo. The interesting thing is how closely it has aligned with San Diego. Previously, it appeared it was only SD in SoCal that was ahead of the curve. Orange Co was next to drop and now were seeing the fall in LA.
Anyhow, if you’re interested in Central Coast historical data or just about any other large US metro you can visit the work at thebubblebuster.com
Rich, I’ll send you a data
Rich, I’ll send you a data set that I bought that has monthly sales and median prices for resale homes for San Diego from ’88.
I’d send the data set to you this evening, but my remote access is OOC, and you’ll get it in the morning when I get into the office.
Wow, 1386 NODs for February
Wow, 1386 NODs for February vs. 1760 sales of SFRs/Condos as reported in the MLS. I realize the NODs aren’t limited to residential properties but that’s still a sobering statistic.
From where I’m standing it’s not looking too good for 3Q/2007.
Is it me or are these charts
Is it me or are these charts both the San Diego defaults and the Credit Suisse Arms Reset Schedule looking freakishly scary!
I agree with asianautica and
I agree with asianautica and nsr. Even though the current spike in NODs is so high, it does not seem like it will be coming down any time soon. Very scary.
We will see a new higher
We will see a new higher plateau in NODs and foreclosures.
One of the most significant
One of the most significant conjectures in Ramsay’s most recent article was that the huge popularity of 80/20 loans recently may be causing a double counting of NODs/Forclosures this time around. He suspects this will stablize as the second trusts figure out they don’t get paid and they are throwing money away in the foreclosure process.
So, in my own calcualtions, I use a 30% discount of the actual number.
1400 x .7 = about 1000 properties got the NOD last month. Assume 50% will end up in forclosure 6 months from now, we should see about 500 real foreclosures/mo by the end of summer.
That old Bananarama song keeps coming to mind… “Cruel Summer” Was that Bananarama?
Good eye, rockclimber. It
Good eye, rockclimber. It seems certain that the NOD/foreclosure stats include properties that have been counted twice. To drill down further, one would need to know how many properties in the early 90’s went through the NOD/foreclosure process and also had a 2nd mtg. Hard to say, but I would guess fewer than today.
Regardless, the question I have yet to hear an anwer to is what is the per capita % of NOD/foreclosures today versus the prior peak.
Regardless, the question I
Regardless, the question I have yet to hear an anwer to is what is the per capita % of NOD/foreclosures today versus the prior peak.
Less good eye. It’s the second graph in the article.
“From where I’m standing
“From where I’m standing it’s not looking too good for 3Q/2007.”
That’s my thinkin’…….ttfn
“Regardless, the question I
“Regardless, the question I have yet to hear an anwer to is what is the per capita % of NOD/foreclosures today versus the prior peak.”
________________________
My statement above was misleading – by “per capita” I was intending to refer to the number of properties in SD, not the population. Rich states that he has been unable to obtain this information so we still don’t have a chart on it. Nice job by Rich, though, with the second chart regarding NOD/foreclosures as a % of the population.
I’m still wondering how many homes today have 2 NOD/foreclosures (1st mtg/2nd mtg) and how that may affect the charts. We would also need to know how many homes in the early 90’s had 2nd mtgs that went NOD/foreclosure. May be too difficult to get this info but one thing is for sure – double-counting homes certainly will have an impact on the charts.
Does anyone know where to
Does anyone know where to find historical NOD/foreclosure info on LA county?
San Diego County had 29,000+
San Diego County had 29,000+ sales through the MLS for 2006. If averaged, that’s just over 2400 sales a month. Even if we say 100% of the NODs are double counted (which would be an obvious overstatement) that still leaves just over 300 resales resulting from foreclosure for the one month. If that trend held true – neither decreasing nor increasing – throughout the year that would mean that by the time the banks get done with these properties about 12% of all sales transactions will involve a bank seller.
That doesn’t count the number of short sales that occur in lieu of foreclosure, or the other “must sell” transactions involving employee relocation transactions, divorce, probate, etc. These properties WILL all sell because their sellers have no other recourse, even if the only way to sell them is to discount them until they can find a buyer.
Assuming that all 100% of the NODs are double counted is the most optimistic way you could possibly look at it, unless you project a reduction in NOD activity or an increase in sales activity. A few of those 2nd TD holders will step up to cure the 1st depending on the circumstances. If we back the 100% down to anything less, the number of bank-owned properties goes up, thereby increasing the number of “must-sell” transactions and putting further pressure on pricing.
I personally think the fallout from junk lending is going to dwarf the fallout from the departure of the Defense industries in the 1980s.
It would be interesting to
It would be interesting to see these foreclosure charts overlayed with price charts. That way we could see from the early 90s the lag between foreclosure increase and price decrease, and draw conclusions about today.
Had the NOD graph been
Had the NOD graph been posted without dates or other explanation it would have looked just like the price increases from 1987-2003.
The curve already looks like the a lagging shadow of the price trends. It should reflect the opposite curve of price increases. The currently increase in the rate of foreclosures is about equal to the current decline in pricing.
Bugs,
Must sell transactions
Bugs,
Must sell transactions absolutely are on the rise and they will continue to rise.
Like to sell transactions are absolutely on the decline and they will continue to decline.
Demand is what it is.
It all comes down to supply and demand. If enough like to sell owners sit it out, the must sell sellers will retain more pricing power.
There is too much we dont know to say how much of an imbalance we will end up with.
That imblance is what will determine what happens to pricing.
SDR
I don’t know that I’d call a
I don’t know that I’d call a changing mix of sellers an imbalance, per se. I think it might be more accurate to say that the typical level of motivation is changing.
I think that once we get to 25% of the sales transactions (not listings) resulting from must-sell conditions those sales will drive the pricing for the other 75%. No buyer will be unaware of their options.
As sdrealtor stated, must
As sdrealtor stated, must sell group is on the rise. Like to sell will always be there and always be enough to sell to the remainder of buyers. The unknown is the demand and how it’ll play out when everybody see price drop year over year for a year or two and lending guideline tighten w/ the subprime mess. Only time will tell.
I agree that demand is the
I agree that demand is the wild card variable here. I think its the jobs picture that will determine what true demand will be. A good chunk of Southern California’s economy has been tied to RE. It now appears RE and RE related jobs are becoming the main drag on the economy. If this thing tips into Recession you will see significant price drops. A recession will put more people into the must sell group while shrinking potential buyers. I am starting to put more emphasis on watching the job numbers than the inventory.
AN,
I dont agree that the
AN,
I dont agree that the like to sell group will always be enough to sell to the remainder of buyers. The nicest properties tend to be owned by this category and they are most likely to hold onto them in the face of a declining market. These are the properties buyers will increasingly be looking for in order to make the leap and they will be increasingly tough to find IMHO. I have several clients in this exact position right now. They have plenty of cash, assets and income to buy what they want but we haven’t been able to find anything they are willing to make the leap for.
SDR
SDR
sdr, I guess we’re referring
sdr, I guess we’re referring to two different market. I’m talking more of the entry level homes rather than the million dollar homes. I’m sure the high end move up market have much more like to sell than must sell. But in the entry level homes, those are the ones that have the highest volumes and also has the most prevalent used to exotic loans and being bought buy people who over stretch since they don’t have any equity to start w/.
Bugs, I think we’ll hit your
Bugs, I think we’ll hit your 25% number this year. Right now we’re on track to sell between 30K and 38K homes in SD County this year. Likewise, if the trend over the last 12 months is any indication we’ll have somewhere between 5K and 6K Trustee Deeds this year (we’ve seen almost 1,000 thus far thru mid-March). So, this particular group of “must sells” will likely amount to somewhere between 15% and 18% of all home sales this year. If you add in another 5%-10% of people that “must sell” for other reasons – moving, ARM resetting, etc., all of a sudden you’re at the 25% figure. My guess is next year will look a lot like this year if the subprime ARM rate re-cast graphs that I’ve seen are anything close to being accurate; that is, roughly 85% of all the subprime ARMs issued between 2003 and 2006 re-cast by the end of 2008. I think we’re entering a tsumami… and this is the (relative) calm before the storm.
Bugs,
Sorry for the
Bugs,
Sorry for the confusion. The imbalance I was referring to was between the number of buyers and sellers.
SDR
Had to look it up. Yep it’s
Had to look it up. Yep it’s Bananarama… one of the great girl bands of the 80’s.