Last month, inventory dropped to the lowest it’s been since the
bubble. Prices have moved up in response.
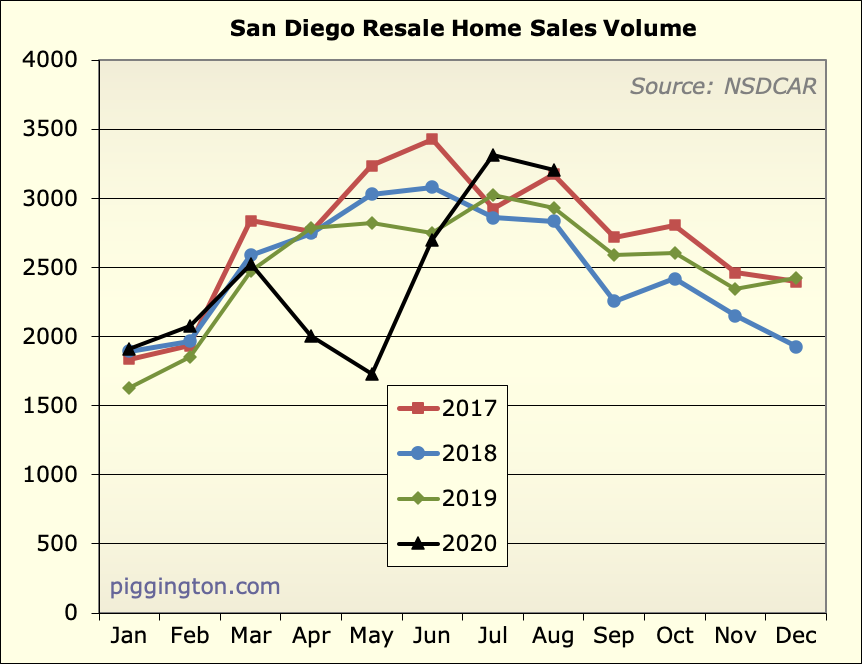
Sales continue to be strong… nothing spectacular, but showing no
weakness at all:
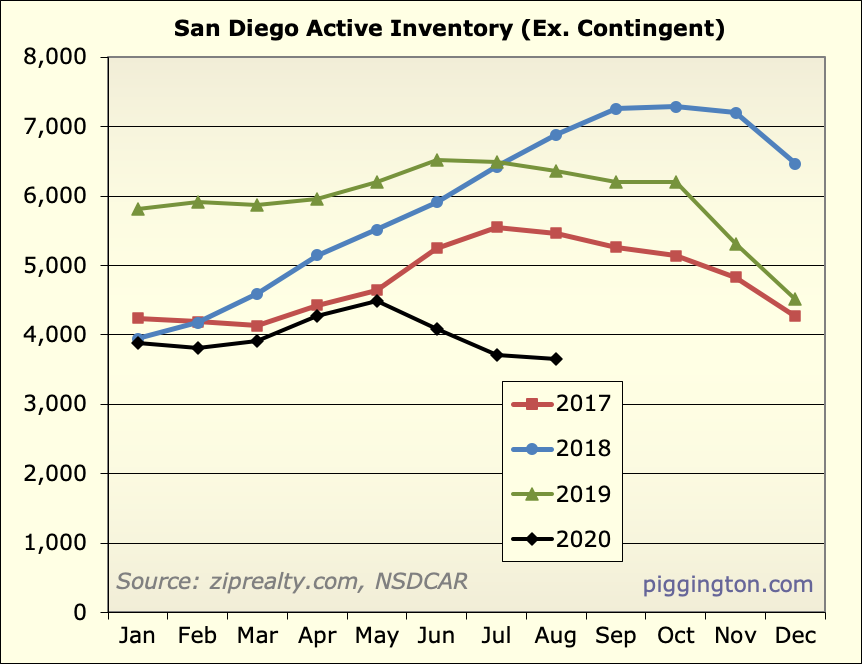
Meanwhile, available inventory has dropped off a cliff:
The result: super low months of inventory:
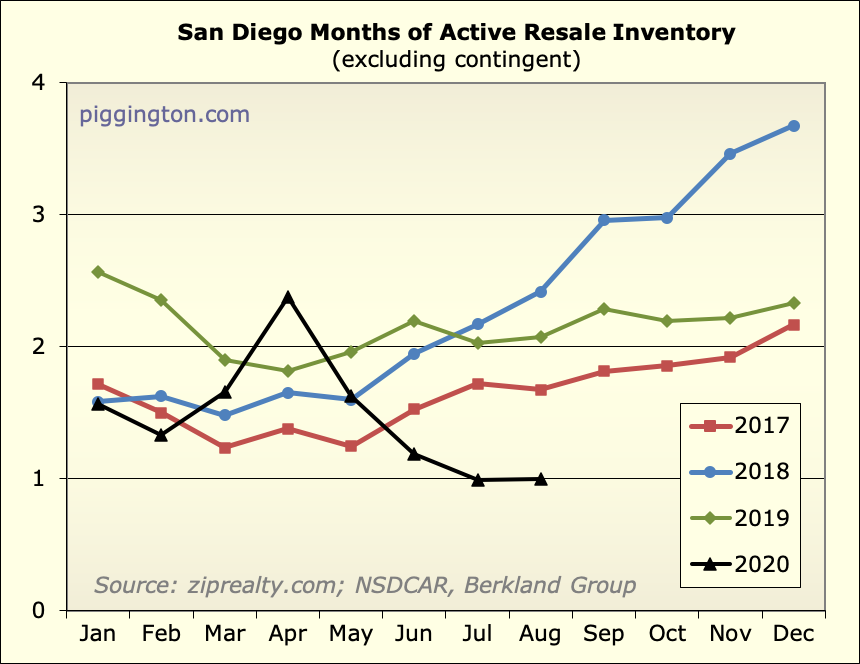
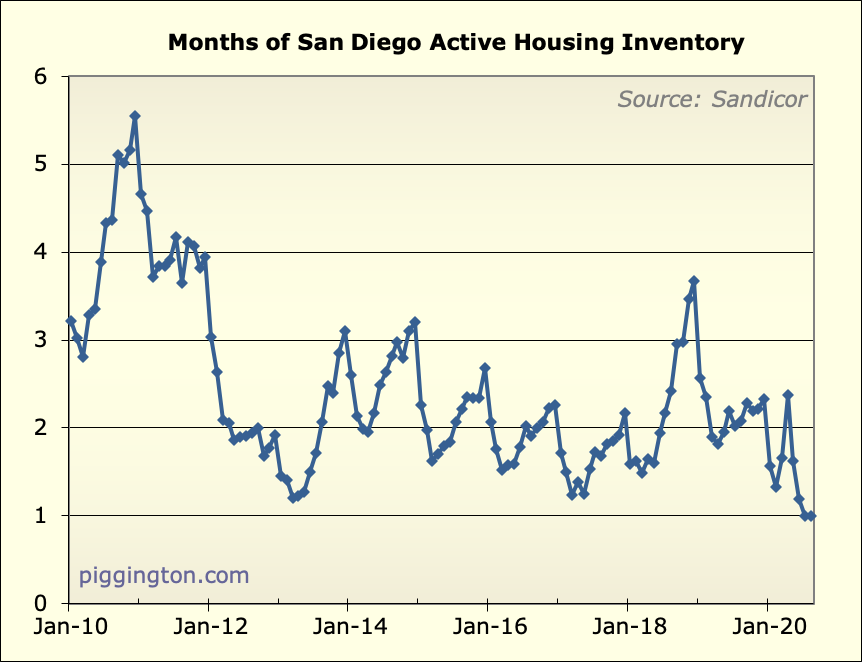
As often discussed here, months of inventory is a good predictor of
short-term price movements. This period has proven to be no
exception, so far:
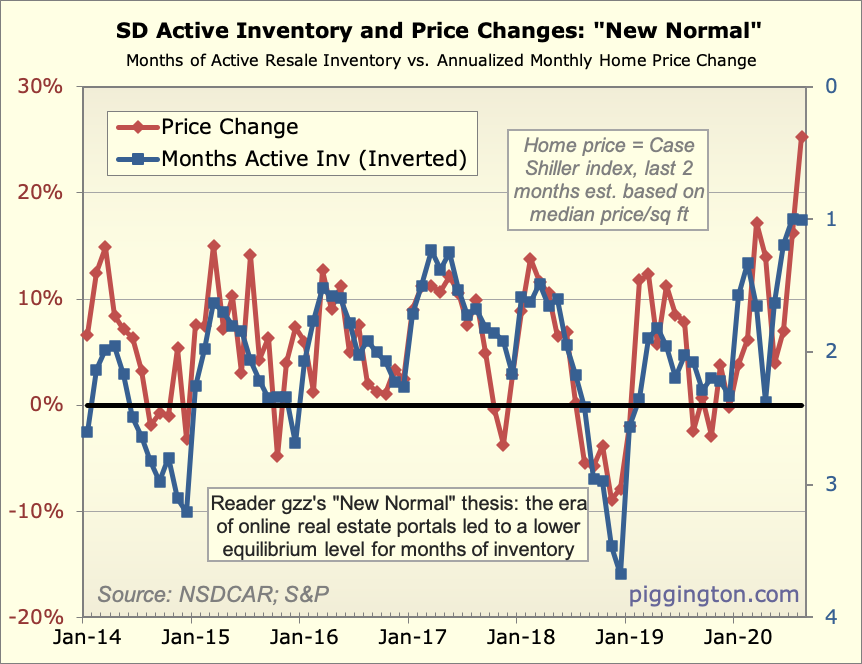
(For those unfamiliar: the blue line above shows months of
inventory, inverted to make the relationship clearer — lower
inventory is represented by the line moving higher. The red line is
monthly price changes.)
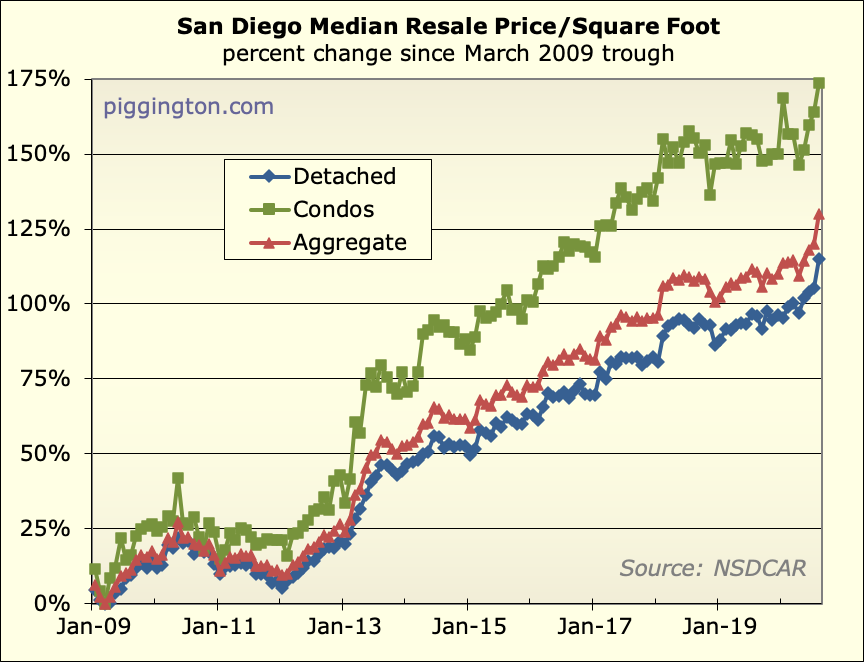
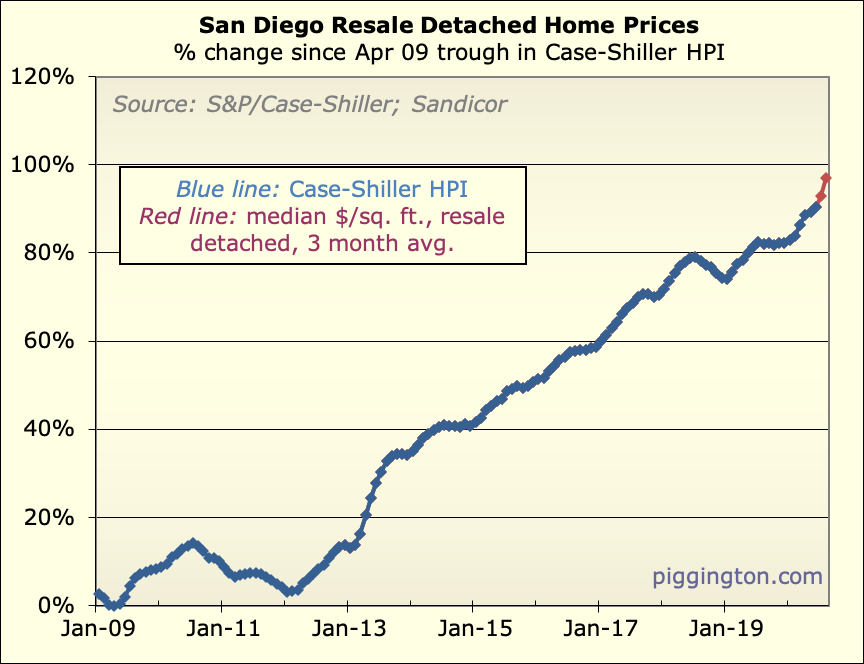
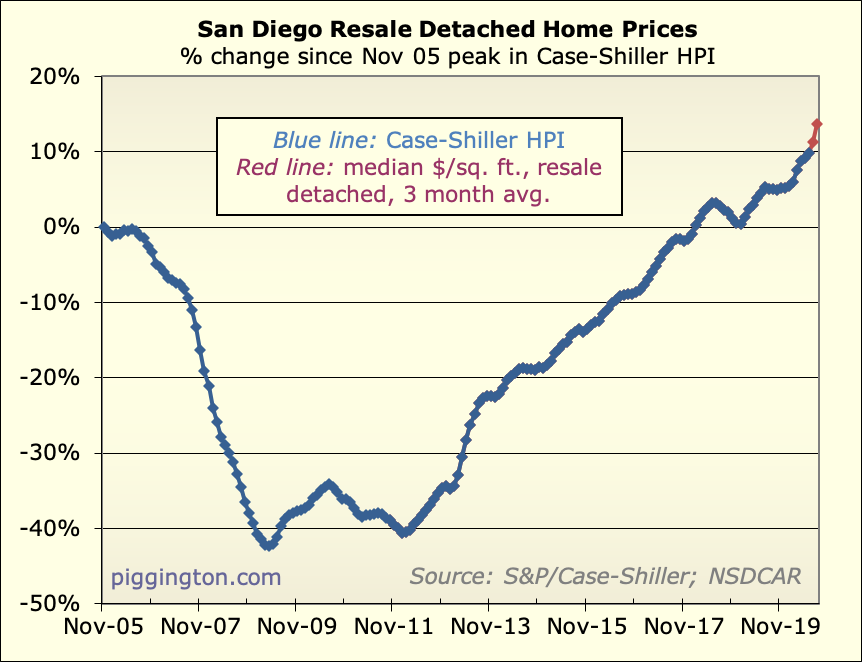
Here are a few price charts. I should convert these to log scale now
that they are so long-term… in any case, the recent price surge is
clearly more than the typical summer strength.
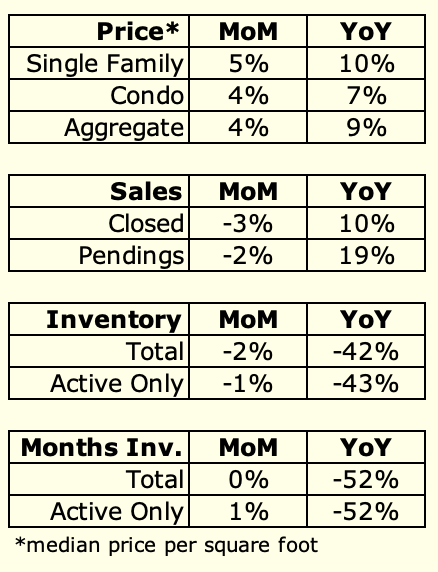
Here’s summary table:
The market is clearly getting a big boost from low interest rates
and the “COVID dynamic” (where people want to buy/upgrade, but
nobody wants to sell). It’s worth keeping in mind that both these
things are (hopefully) temporary. Once life and the economy return
to normal, both rates and the housing supply/demand dynamics should
go back to where they were before.
One thing that might be permanent
is an increased bias towards home ownership if a lot of people start
to permanently work from home. That would be good for housing
demand, but I have a feeling that the rates+COVID dynamic thing is a
much bigger factor. And those will, at some point, be reversed. For
now, though, the market is super tight and prices are responding
accordingly.
Thanks, great news all
Thanks, great news all around.
I’m not a fan of log scale charts.
You know the market is strong when a house with no back yard and purple shag carpet sells for $1,140 per sq ft. I think I’d demand it be removed prior to closing, probably 50 years of organic particles buried within a bunch of banned chemicals.
https://www.sdlookup.com/Pictures-200028964
gzz wrote:Thanks, great news
[quote=gzz]Thanks, great news all around.
I’m not a fan of log scale charts.
You know the market is strong when a house with no back yard and purple shag carpet sells for $1,140 per sq ft. I think I’d demand it be removed prior to closing, probably 50 years of organic particles buried within a bunch of banned chemicals.
https://www.sdlookup.com/Pictures-200028964%5B/quote%5D
Quoting housing prices per square foot particularly near the beach is a fatal analytical flaw. It is not reflective of market strength but merely reflective of a small house on a valuable piece of land. I always say-What you are standing on is far more valuable than what you are standing in.
Any chance you have updates
Any chance you have updates to the charts for home valuation and monthly payment indices that go back to the 1970’s? Similar to your post in Aug 2019.
thank you!
-EJ
EJ wrote:Any chance you have
[quote=EJ]Any chance you have updates to the charts for home valuation and monthly payment indices that go back to the 1970’s? Similar to your post in Aug 2019.
thank you!
-EJ[/quote]
Yes I think it would be a good time to update those! I will put it on my to-do list. 🙂
Rich, I am looking at the
Rich, I am looking at the months of supply and price change “New Normal” graph. For the spike up to a recent record of about 26%, is that the annualized increase based on the past two months?
It can’t be based on the MoM 5% jump since that is 60% annualized, nor the YoY figure of 9%.
gzz wrote:Rich, I am looking
[quote=gzz]Rich, I am looking at the months of supply and price change “New Normal” graph. For the spike up to a recent record of about 26%, is that the annualized increase based on the past two months?
It can’t be based on the MoM 5% jump since that is 60% annualized, nor the YoY figure of 9%.[/quote]
It is the monthly change, annualized, of the “price”.
The “price” is:
– Case-Shiller for all but the last 2 months
– last 2 months: 3 month avg of single-family price/sq ft (so chosen because Case Shiller uses a 3 month average as well)
So annualized monthly change
So annualized monthly change of the three month rolling average. Impressive Excel jujitsu!
Looking forward to the
Looking forward to the pending refresh.
Our escrow closed on the 30th and was told the recorders office/escrow was very busy.
It’s anecdotal but would expect another drop in inventory.
Prices continue to climb in 92027/92127/92078.
I’m seeing a lot more for
I’m seeing a lot more for sale signs in the College area and La Mesa when I’m out and about on my bicycle. I don’t think that translates to increased inventory, more likely it just means more houses that went on the market for 2-3 days before receiving an offer. It seems to be a domino effect, I see one house on a street sale and then a month or two later another one, in this case on Revillo Way two of them coming online soon. People find out how much their neighbor got and they get excited. I’m not sure where they are going, everyone says people are leaving San Diego, but I suspect some are just moving up to a nicer home or maybe they are retiring to Arizona where it’s cheaper. We’re probably just replacing old money (lower middle class) with new (upper middle class), two spouses working in tech making 6 figures to pay those giant new mortgage payments (which ironically are pretty low considering the rates). If the rates go up, I predict this ride is over for housing.