My favorite single indicator of housing market strength is the
following ratio:
(active inventory for sale) / (number of monthly pending sales)
This ratio is called “months of inventory,” because it measures how
many months it would take to sell the current amount of inventory at
the current sales pace. Thus it is a handy single indicator of both
supply and demand. It also happens to be very predictive of
near-term price changes (a relationship which I first learned of
from the great Bill McBride).
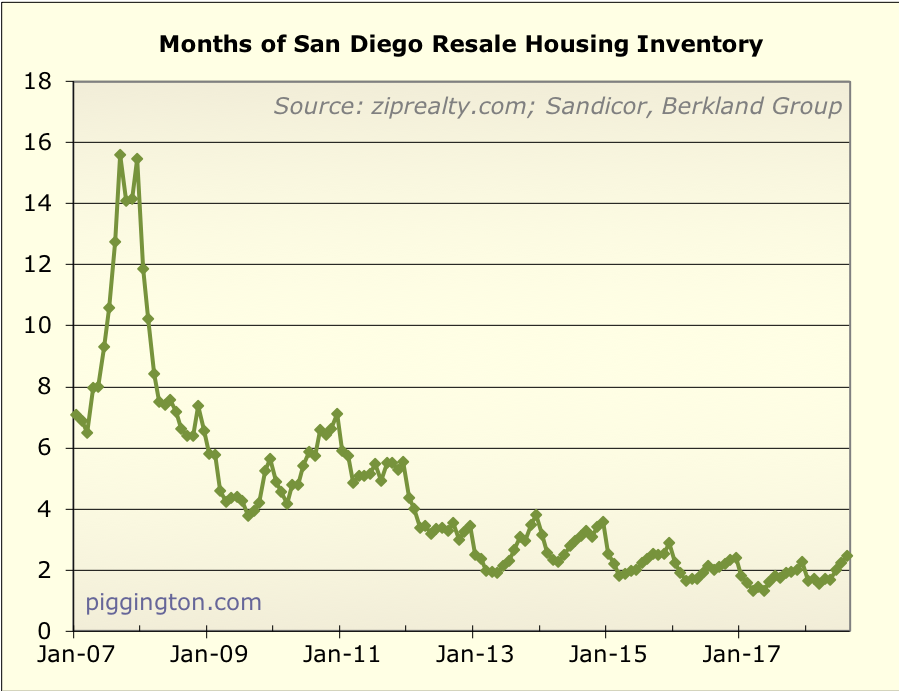
Getting on with the current state of affairs: the
months-of-inventory ratio (let’s called it MI for this post!) shows
that the market has cooled off quite a bit in recent months. Here’s
a graph of MI for each month over the past almost-4 years:
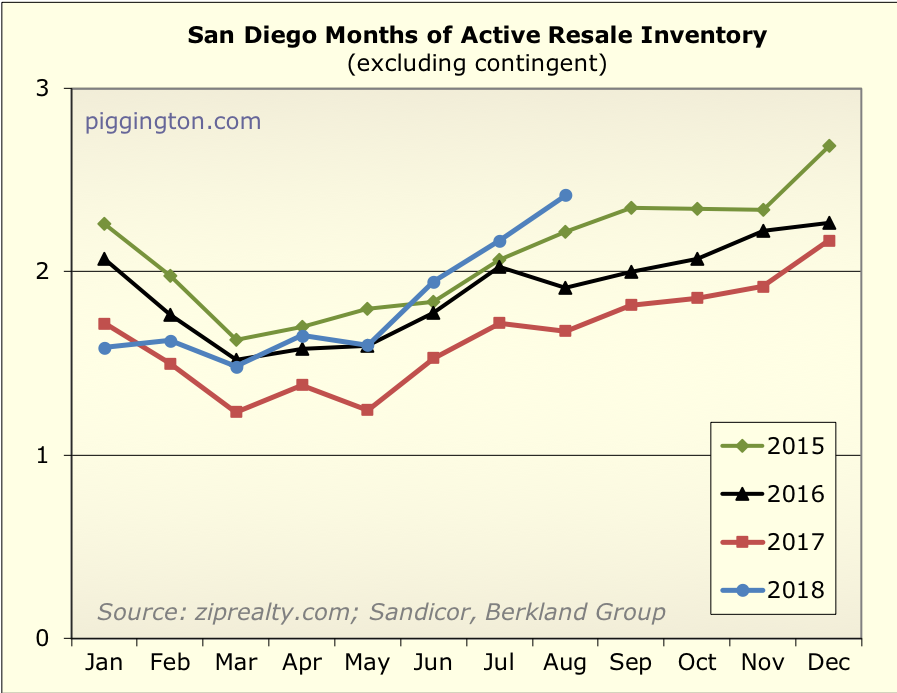
Up until May, MI had been cruising along at levels that are pretty
typical for recent years (although well above 2017’s level). After
that, however, it started to rise and now stands as the weakest (by
this metric) August in the past four years.
I noted that 2017 was a very tight market, with low months of
inventory. August’s MI was up 44% year over year! However, the above
graph shows that we aren’t that far above 2015 levels, and the next
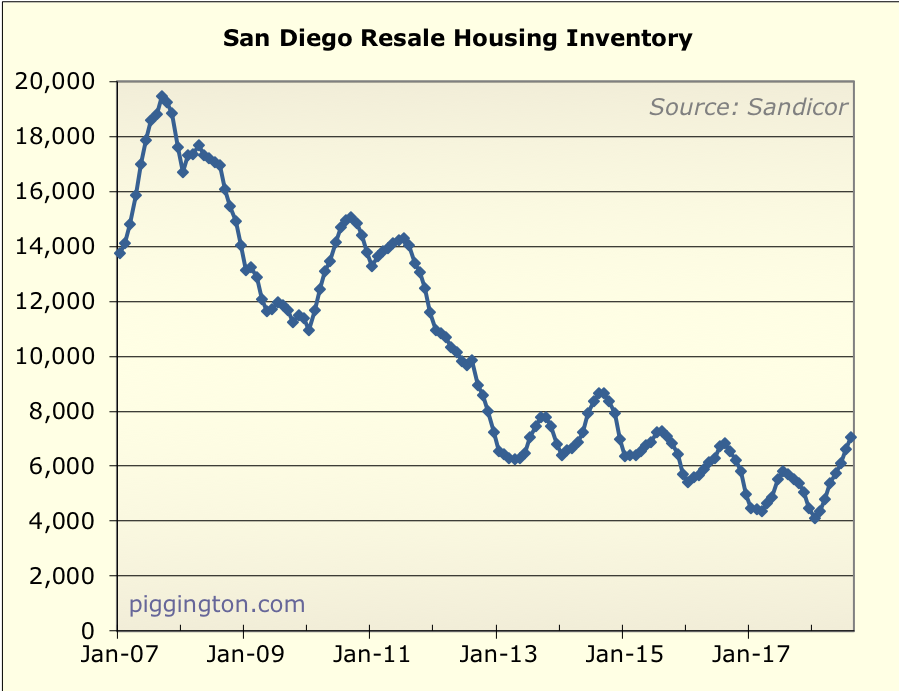
graph shows that MI is still below levels it hit in 2014:
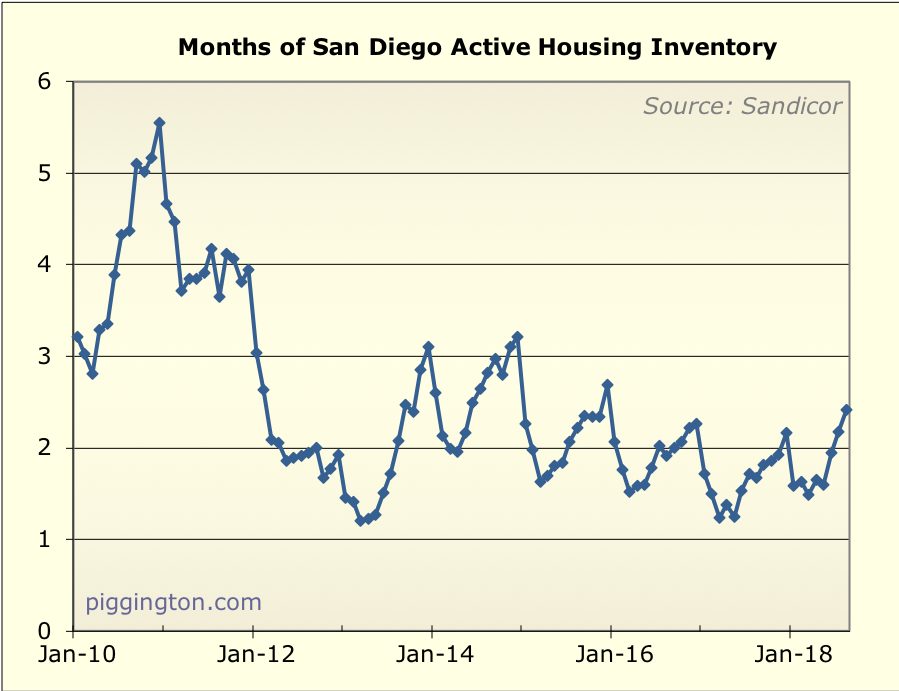
So, there’s nothing extraordinary or panic-worthy here… the market
is a good amount weaker than it was in recent times, but that’s
coming from a very hot market, so things are still very much in the
realm of normalcy at this time.
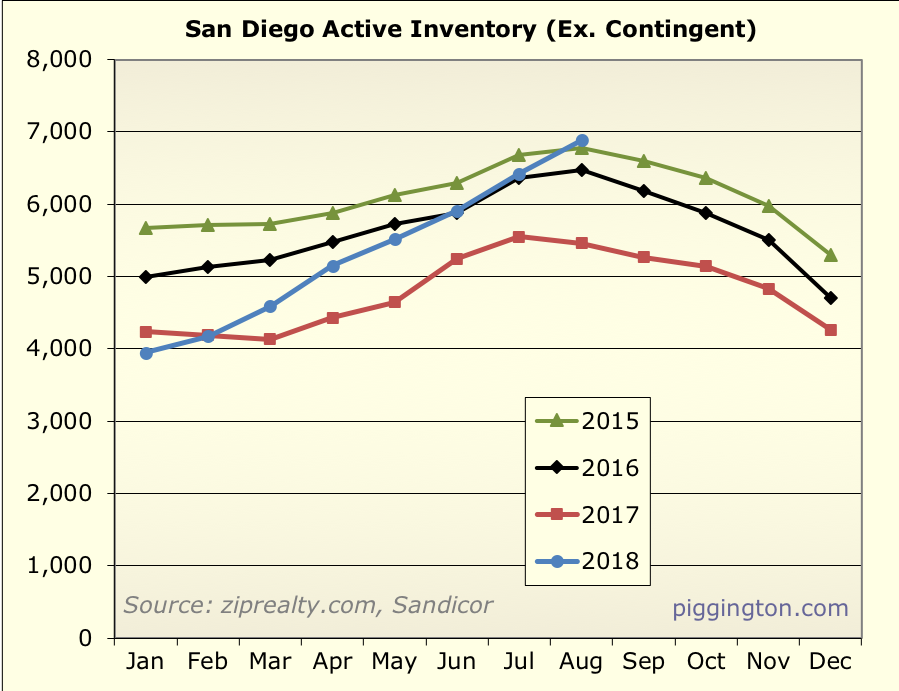
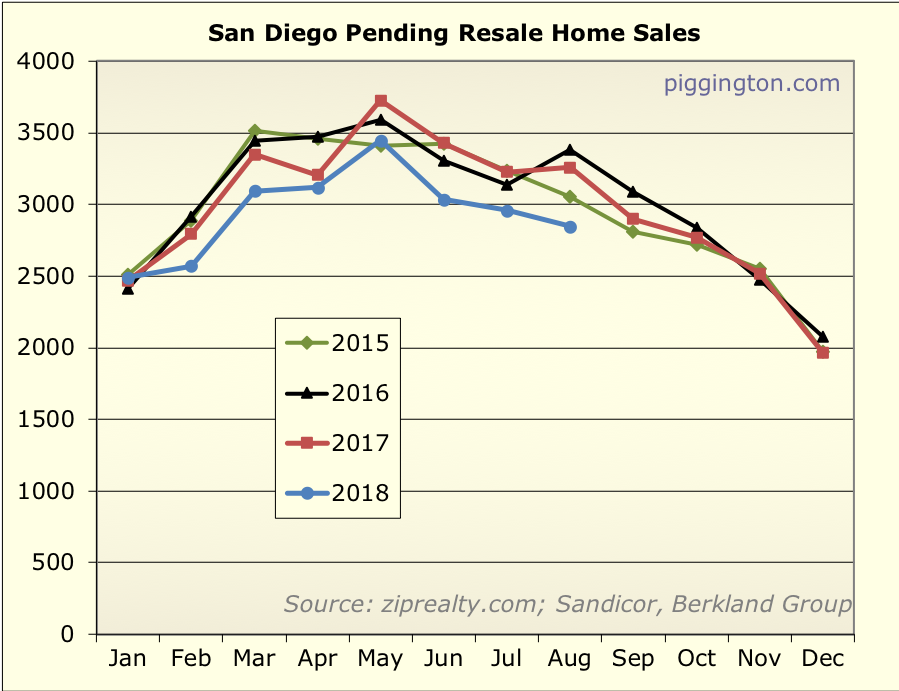
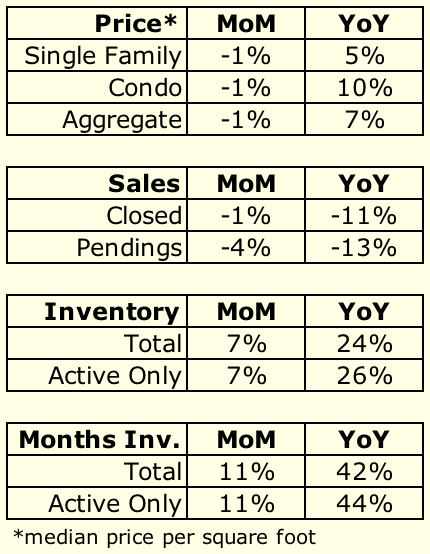
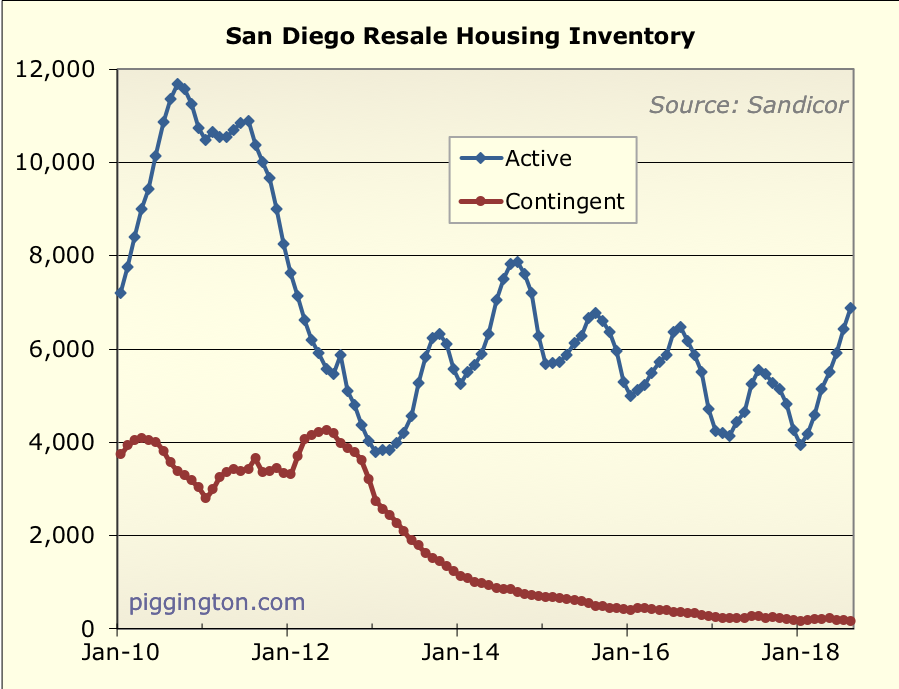
The increase in MI is coming from both sides — higher inventory,
and lower sales. Of the two, the increase in inventory is more
pronounced compared to last year… inventory is up 26% while sales
are down 13% from Auguest 2017:
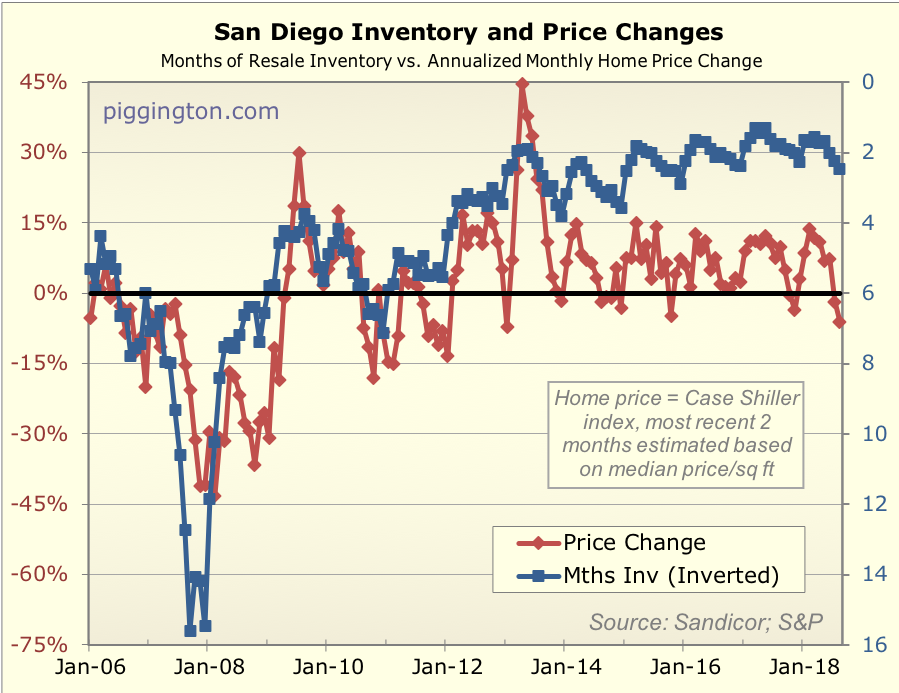
Prices were accordingly pretty weak… here’s MI (inverted) vs. the
monthly price change:
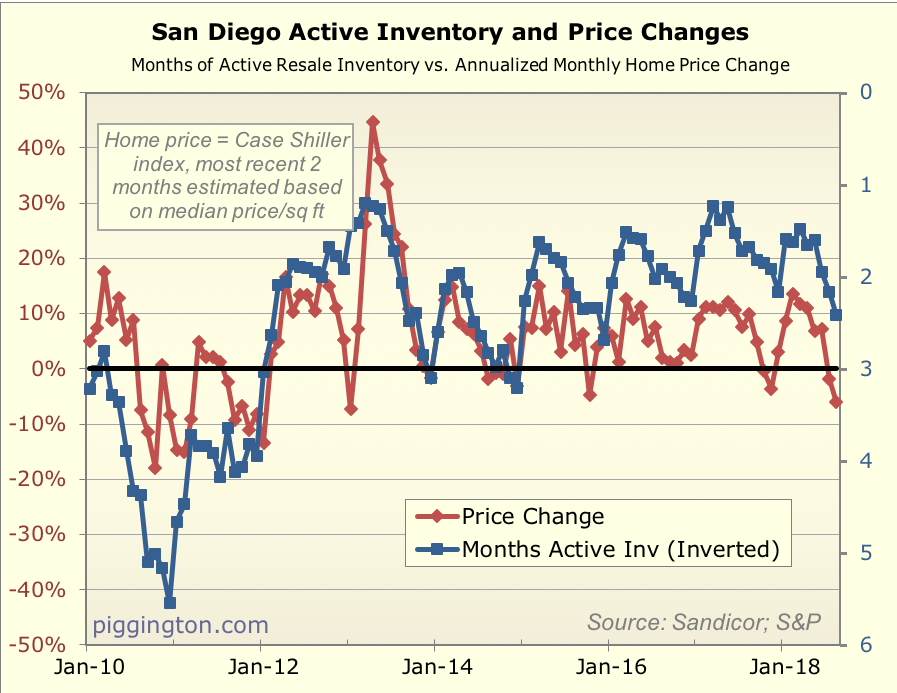
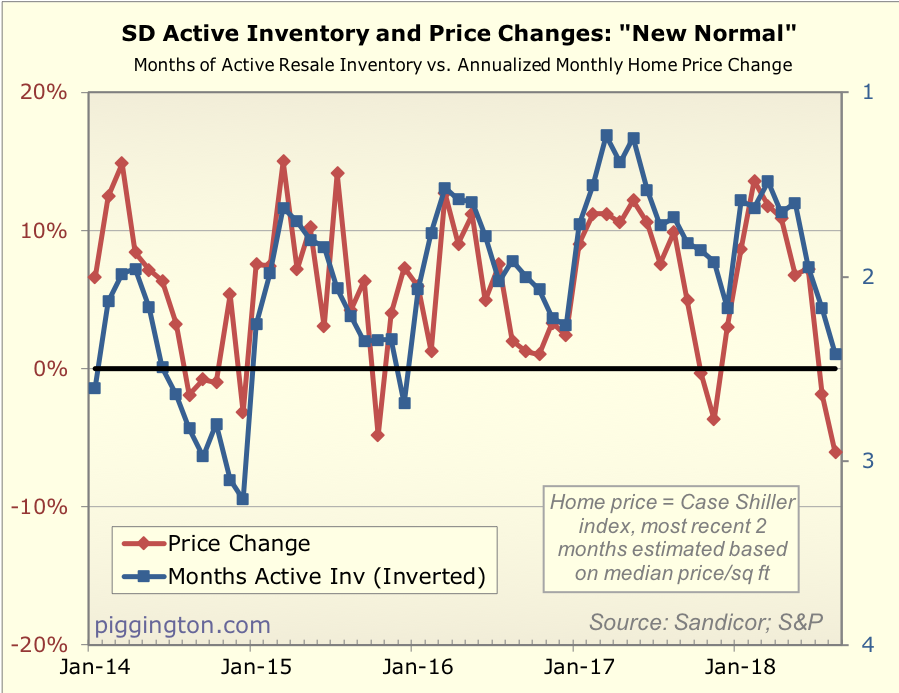
And here’s the same chart zooming in on recent years, with the scale
changed to reflect the hypothesis that in the post-Redfin etc era,
there is a “new normal” for lower months of inventory (thanks to
reader gzz for that idea):
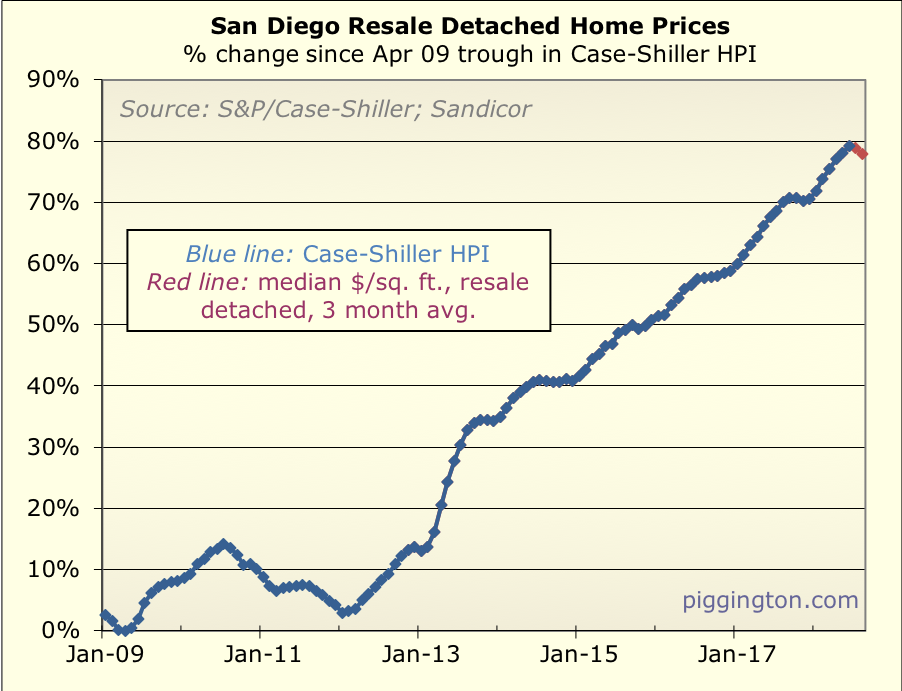
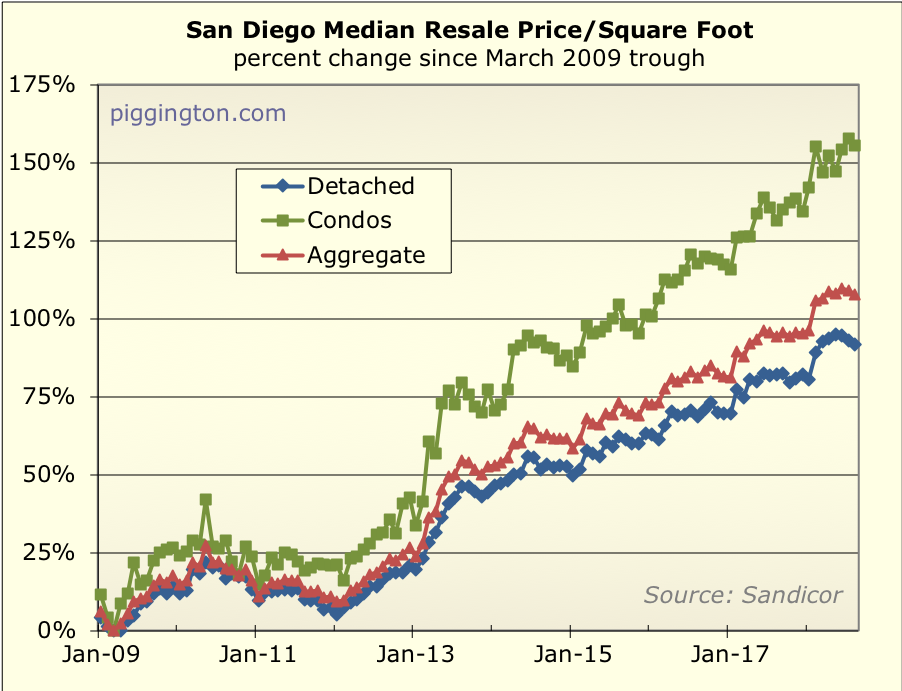
For the first time in quite a while, we may be looking at some
softness or weakening of prices. We’ll see what the typical slow
fall season brings. In the meantime, here’s prices up til now:
I suspect very strongly that mortgage rates are playing a role. Over
the past year, the 30 year mortgage rate has increased by over 80
bps. This is, relatively, a pretty huge jump given that the low was
about 3.8%… going from 3.8% to 4.6% amounts to about a 10%
increase in monthly payments. Add that to the ~5% increase in prices
over that time, and affordability has gotten a whole lot worse. The
increase in months of inventory suggests that we may finally be
nearing the affordability tipping point, where buyers can’t take it
any more.
More graphs below!
It is funny how quickly the
It is funny how quickly the market can turn. I guess the question is if case shiller will turn negative based on price/sf prediction. If so, we may fall back below the prior peak again. Especially if a recession hits in the next two years, we may have a hard time keeping prices above the peak. In which case, CNBC Dianne will write an article in 2022 on how prices are below what it was 15 years ago and how housing it terrible— and that will be exactly the time to jump all in again….
Rising interest rates. Airbnb
Rising interest rates. Airbnb regulations. Chinese capital controls working. I am not surprised with slow down. And it is a good thing. Trees do not grow to the sky and house prices cannot grow at 8% forever.
The difference with 2004-5 is the lack of mania driving the prices. In 2004 my two postdoc friends were looking at townhomes to buy to make “15% a year”, a PhD student was trying to find a parcel of land in Alpine so he did not “get shut out of the market”. Fortunately, none of them managed to buy. PB bubble, Rich, and Dr Housing were lonely voices.
I haven’t heard the same sort of mania this time. And lots of people has been predicting a slow down/crash.
Don’t forget about the new
Don’t forget about the new tax rules that limit deductions. Lots of things working against rising house prices which is why i’m shocked that they are as high as they are. Still isn’t a “normal” market considered 6 months of inventory?
That doesn’t appear to be the
That doesn’t appear to be the case any more (if it ever was), see the last chart…
Is there a way to look at
Is there a way to look at inventory data going back to 2002? It feels like 2004-5
San Diego was #1 for income
San Diego was #1 for income growth in the 50 largest US metro areas!
http://www.sandiegouniontribune.com/business/economy/sd-fi-sandiego-incomegrowth-20180914-story.html
This site says San Diego’s average apartment rents went up 5.0% between Aug 2017 and Aug 2018, better than the 3.1% national figure.
https://www.rentcafe.com/blog/rental-market/apartment-rent-report/august-rents-rose-3-1-fastest-pace-18-month-apartment-construction-slows/
Here is a second source saying San Diego rent growth was about 5%:
https://www.globest.com/2018/08/06/san-diego-multifamily-rents-surge-5/?slreturn=20180818195040
Would you sell a rental given Rich’s 7% YoY reported price increase and this 5% YoY rent increase in the background of strong economic growth and regulation/labor costs that make new construction very difficult? Not me! I am starting to feel like a boomer on my first purchase with my property tax bill less than half of what it should be.
Construction activity up
Construction activity up strongly from 2017, but still far below pre-2008 levels.
http://www.sandiegouniontribune.com/business/real-estate/sd-fi-homebuilding-permits-20180829-story.html
Keep this in mind when looking at the new construction numbers below: (1) San Diego County’s population growth is about 38,000 per year (2) the 10k or so construction permits don’t deduct demolished units they take the place of. So we may only be talking about more like 8k net new living units for 38,000 new people.
Looking at the city of San Diego, population went up from 1.31 to 1.42 million between 2010 and 2017, 112,000 new residents. But with infill development, San Diego has fewer traditional single family homes with unshared lots.
———–
“Although going over the 10,000 mark would be notable compared to past years, it still falls short of the housing boom years. In 2004, there were 17,306 residential permits issued in San Diego County and 15,258 in 2005.
Alan Nevin, industry analyst at Xpera Group, said the building so far this year is led by apartment construction downtown, demand for townhouses (classified as condos in multifamily permits) and an abundance of projects in the master-planned community of Otay Ranch.
“It’s basically all Otay Ranch with a little bit along (State Route) 78,” he said of new single-family homes and townhouses. “There are like 30 projects under construction in Otay Ranch, a combination of attached, detached and rental.”
Multifamily construction, condos and apartments, led building in San Diego County in the first six months. There were 4,948 multifamily permits issued, up from 2,633 at the same time last year.
Single-family home construction continued to be a small part of the market with 2,005 permits, but it was an increase from 1,603 permits at the same time last year.
—————–
Just some anecdotal evidence,
Just some anecdotal evidence, I get calls from apt brokers all the time because I have rental properties,… anyway from what I gather there has been a slow down in this segment of the RE market as well
I am seeing rent growth
I am seeing rent growth slowing. It takes significantly longer to rent out properties as “market rate everybody is listing at. It should be the rented price not the list price that counts and that has definitely slowed or reversed. Maybe that is good, renter need a break.
Ok Rich would you agree
Ok Rich would you agree normal inventory is in the 4-6 month range? Looks like inventory has increased by 50% in the last 6 months in most zip codes as seen on sdlookup.com
Based on this chart:
…it
Based on this chart:
…it looks like typical inventory has been about 2 months over the past 5 years, and “neutral” (the difference between rising and falling prices) has been about 2.5 months.
Refering to the last chart
Refering to the last chart which goes back 12 years it appears that average active inventory is in the 4-6 month range, possibly closer to 6 months. Has the definition of active inventory changed during that time, i.e. pendings? I don’t mean to disparage gzz idea of “new normal”, but when speaking of averages I think the more data the better. Perhaps a correlation exists between interest rates and inventory, higher rates-higher inventory.
No, the definition has not
No, the definition has not changed.
I appreciate your point about basing things on the data. But, the chart you are looking at includes the biggest-ever housing crash…I don’t think you can really average that period in when trying to determine “normal” inventory months. Unfortunately I don’t have any data further back than that.
Rich, CalculatedRisk blog
Rich, CalculatedRisk blog during the crash tracked inventory ratios on a national basis, and always said 3 to 6 months was a normal market. That was presumably the long term US range from the 90’s until the bubble really got going.
https://www.schwab.com/resour
https://www.schwab.com/resource-center/insights/content/with-or-without-you-can-economy-still-hum-if-housing-falters
check out the 3rd to last graph
inventory going back to 1982
not local but gives you an idea of what normal used to be.
That’s good. I guess I was
That’s good. I guess I was assuming that SD could be totally different from the nationwide average, but I’m not sure why that would be the case. (Although: it HAS been different for the recent period where I have data).
From Oct 2012 to May 2013, 30
From Oct 2012 to May 2013, 30 rates ranged from 3.3 to 3.6%.
Then from July 2013 to Oct 2014, they ranged from 4.1 to 4.6%. Using the midpoints, the average rate thus increased from 3.45% to 4.35%. That even larger monthly-payment percentage increase didn’t seem to cause any problem for the market. We are currently only about 0.25% over the rates from that 16-month period. So I don’t see 4.6% 30 years as a real worry. And they went back down in Nov 2014 below 4.1%, and then stayed below it until Dec 2016.
The Fed also has more rate cut ammo to boost the economy if it starts to slow than it did a few years ago.